16. Control panels
[1]:
import asyncio
import re
import sys
import time

import numpy as np
import pandas as pd

import serial
import serial.tools.list_ports

import bokeh.plotting
import bokeh.io
import bokeh.layouts
import bokeh.driving
bokeh.io.output_notebook()

notebook_url = "localhost:8888"
We have seen how to create buttons for controlling data acquisition, how to asynchronously acquire streaming data, and how to have automatically updating plots. Taken together, you now have the tools to build a control panel for a device. When building a device, it is important to have intuitive controls and displays to get the most out of your device. Not only does this speed up your work, it also enables other researchers to easily use your device.
You are of course thoughtful about the physical design of any device you make. There’s no option; it won’t work if you don’t build it well. At the same time, you should also be thoughtful about how you interface with the device. This is often overlooked. I view it as similar to software that has a bad, poorly documented API. No one, not even future you, will know how to operate your device unless you are careful about its interface and documentation.
We will again use the setup of the last few lessons with the same utility functions. You can again skip ahead to the next section after running the code cells below.
[2]:
def find_arduino(port=None):
    """Get the name of the port that is connected to Arduino."""
    if port is None:
        ports = serial.tools.list_ports.comports()
        for p in ports:
            if p.manufacturer is not None and "Arduino" in p.manufacturer:
                port = p.device
    return port


def handshake_arduino(
    arduino, sleep_time=1, print_handshake_message=False, handshake_code=0
):
    """Make sure connection is established by sending
    and receiving bytes."""
    # Close and reopen
    arduino.close()
    arduino.open()

    # Chill out while everything gets set
    time.sleep(sleep_time)

    # Set a long timeout to complete handshake
    timeout = arduino.timeout
    arduino.timeout = 2

    # Read and discard everything that may be in the input buffer
    _ = arduino.read_all()

    # Send request to Arduino
    arduino.write(bytes([handshake_code]))

    # Read in what Arduino sent
    handshake_message = arduino.read_until()

    # Send and receive request again
    arduino.write(bytes([handshake_code]))
    handshake_message = arduino.read_until()

    # Print the handshake message, if desired
    if print_handshake_message:
        print("Handshake message: " + handshake_message.decode())

    # Reset the timeout
    arduino.timeout = timeout


def read_all(ser, read_buffer=b"", **args):
    """Read all available bytes from the serial port
    and append to the read buffer.

    Parameters
    ----------
    ser : serial.Serial() instance
        The device we are reading from.
    read_buffer : bytes, default b''
        Previous read buffer that is appended to.

    Returns
    -------
    output : bytes
        Bytes object that contains read_buffer + read.

    Notes
    -----
    .. `**args` appears, but is never used. This is for
       compatibility with `read_all_newlines()` as a
       drop-in replacement for this function.
    """
    # Set timeout to None to make sure we read all bytes
    previous_timeout = ser.timeout
    ser.timeout = None

    in_waiting = ser.in_waiting
    read = ser.read(size=in_waiting)

    # Reset to previous timeout
    ser.timeout = previous_timeout

    return read_buffer + read


def read_all_newlines(ser, read_buffer=b"", n_reads=4):
    """Read data in until encountering newlines.

    Parameters
    ----------
    ser : serial.Serial() instance
        The device we are reading from.
    n_reads : int
        The number of reads up to newlines
    read_buffer : bytes, default b''
        Previous read buffer that is appended to.

    Returns
    -------
    output : bytes
        Bytes object that contains read_buffer + read.

    Notes
    -----
    .. This is a drop-in replacement for read_all().
    """
    raw = read_buffer
    for _ in range(n_reads):
        raw += ser.read_until()

    return raw


def parse_read(read):
    """Parse a read with time, volage data

    Parameters
    ----------
    read : byte string
        Byte string with comma delimited time/voltage
        measurements.

    Returns
    -------
    time_ms : list of ints
        Time points in milliseconds.
    voltage : list of floats
        Voltages in volts.
    remaining_bytes : byte string
        Remaining, unparsed bytes.
    """
    time_ms = []
    voltage = []

    # Separate independent time/voltage measurements
    pattern = re.compile(b"\d+|,")
    raw_list = [
        b"".join(pattern.findall(raw)).decode()
        for raw in read.split(b"\r\n")
    ]

    for raw in raw_list[:-1]:
        try:
            t, V = raw.split(",")
            time_ms.append(int(t))
            voltage.append(int(V) * 5 / 1023)
        except:
            pass

    if len(raw_list) == 0:
        return time_ms, voltage, b""
    else:
        return time_ms, voltage, raw_list[-1].encode()


def parse_raw(raw):
    """Parse bytes output from Arduino."""
    raw = raw.decode()
    if raw[-1] != "\n":
        raise ValueError(
            "Input must end with newline, otherwise message is incomplete."
        )

    t, V = raw.rstrip().split(",")

    return int(t), int(V) * 5 / 1023


def request_single_voltage(arduino):
    """Ask Arduino for a single data point"""
    # Ask Arduino for data
    arduino.write(bytes([VOLTAGE_REQUEST]))

    # Read in the data
    raw = arduino.read_until()

    # Parse and return
    return parse_raw(raw)
The schematic we will use is shown below.

The sketch is
const int voltagePin = A0;

const int HANDSHAKE = 0;
const int VOLTAGE_REQUEST = 1;
const int ON_REQUEST = 2;
const int STREAM = 3;
const int READ_DAQ_DELAY = 4;

// Initially, only send data upon request
int daqMode = ON_REQUEST;

// Default time between data acquisition is 100 ms
int daqDelay = 100;

// String to store input of DAQ delay
String daqDelayStr;


// Keep track of last data acquistion for delays
unsigned long timeOfLastDAQ = 0;


unsigned long printVoltage() {
  // Read value from analog pin
  int value = analogRead(voltagePin);

  // Get the time point
  unsigned long timeMilliseconds = millis();

  // Write the result
  if (Serial.availableForWrite()) {
    String outstr = String(String(timeMilliseconds, DEC) + "," + String(value, DEC));
    Serial.println(outstr);
  }

  // Return time of acquisition
  return timeMilliseconds;
}


void setup() {
  // Initialize serial communication
  Serial.begin(115200);
}


void loop() {
  // If we're streaming
  if (daqMode == STREAM) {
    if (millis() - timeOfLastDAQ >= daqDelay) {
      timeOfLastDAQ = printVoltage();
    }
  }

  // Check if data has been sent to Arduino and respond accordingly
  if (Serial.available() > 0) {
    // Read in request
    int inByte = Serial.read();

    // If data is requested, fetch it and write it, or handshake
    switch(inByte) {
      case VOLTAGE_REQUEST:
        timeOfLastDAQ = printVoltage();
        break;
      case ON_REQUEST:
        daqMode = ON_REQUEST;
        break;
      case STREAM:
        daqMode = STREAM;
        break;
      case READ_DAQ_DELAY:
        // Read in delay, knowing it is appended with an x
        daqDelayStr = Serial.readStringUntil('x');

        // Convert to int and store
        daqDelay = daqDelayStr.toInt();

        break;
      case HANDSHAKE:
        if (Serial.availableForWrite()) {
          Serial.println("Message received.");
        }
        break;
    }
  }
}
Python-based dashboarding
Panel is an excellent package for building dashboards. You have used it to make toggle button controls in Lesson 11. You can use it to conveniently make apps for non-streaming data. And you will be able to use it for streaming applications in the next release. Unfortunately, as of September 2020, that release is not out yet, so we will proceed building dashboards with base Bokeh, which is what Panel uses under the hood to build its apps.
Do not despair, though, base Bokeh is still pretty accessible for these kinds of applications.
In the following sections, we will build a dashboard for controlling our little potentiometer device in a Jupyter notebook. As a follow-along exercise, you will make a stand-along app that you can have in the browser for controlling the device.
Sketching a dashboard
I find it is always helpful to first sketch how I would like my dashboard to look. The first version I came up with is this:
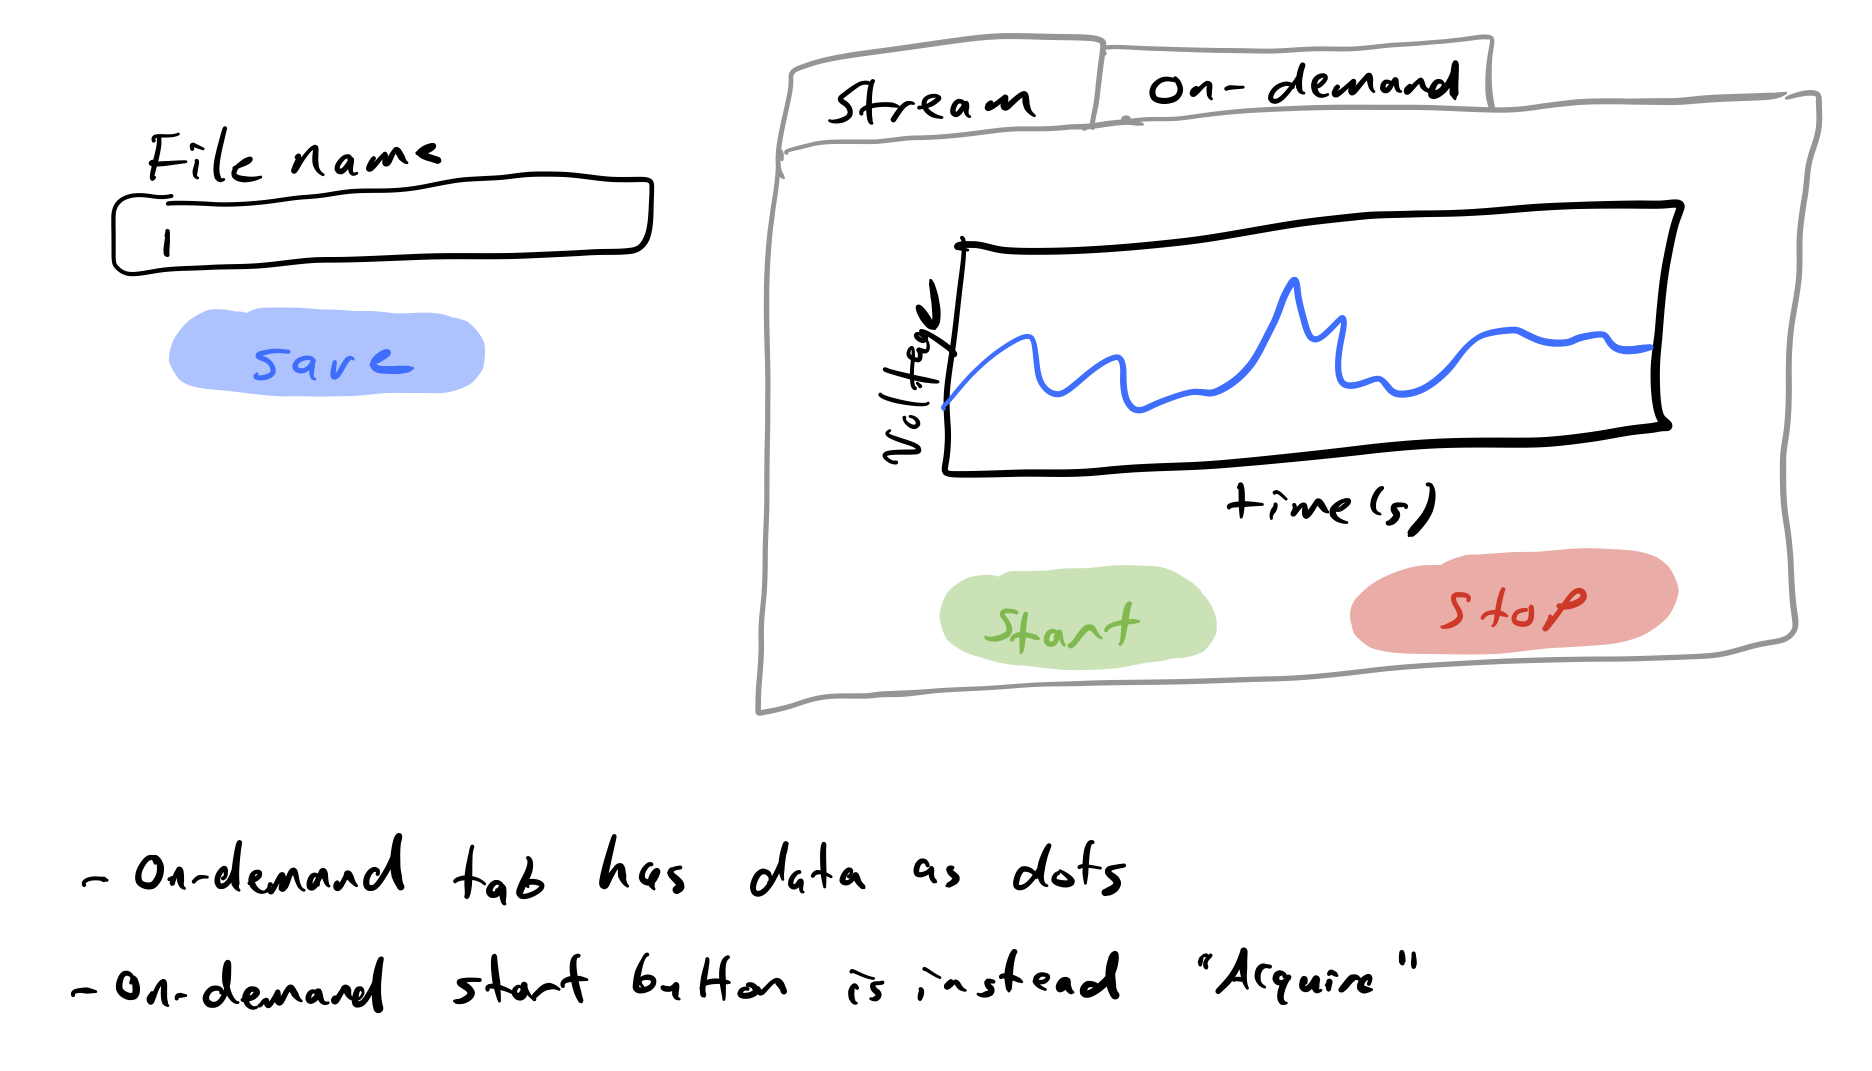
The idea is that I have a tabbed plot (which is possible in Bokeh). The user chooses either to be in streaming mode or to be in on-demand mode by selecting the tab. Streaming starts by pressing the start button (it is “Acquire” in on-demand mode), and stops by pressing the stop button. Streaming is allowed to begin again by again pressing start. To save the data, the user can enter a file name and click the save button.
I built this app, and then realized some problems with it.
It is ambiguous whether to save streaming or on-demand data in the event that both are happening at the same time.
There actually is no stop button for on-demand. (Duh!)
If data are streaming and the user switches to on-demand mode, the user cannot see the streaming data anymore.
I scrapped this design and moved on to another.
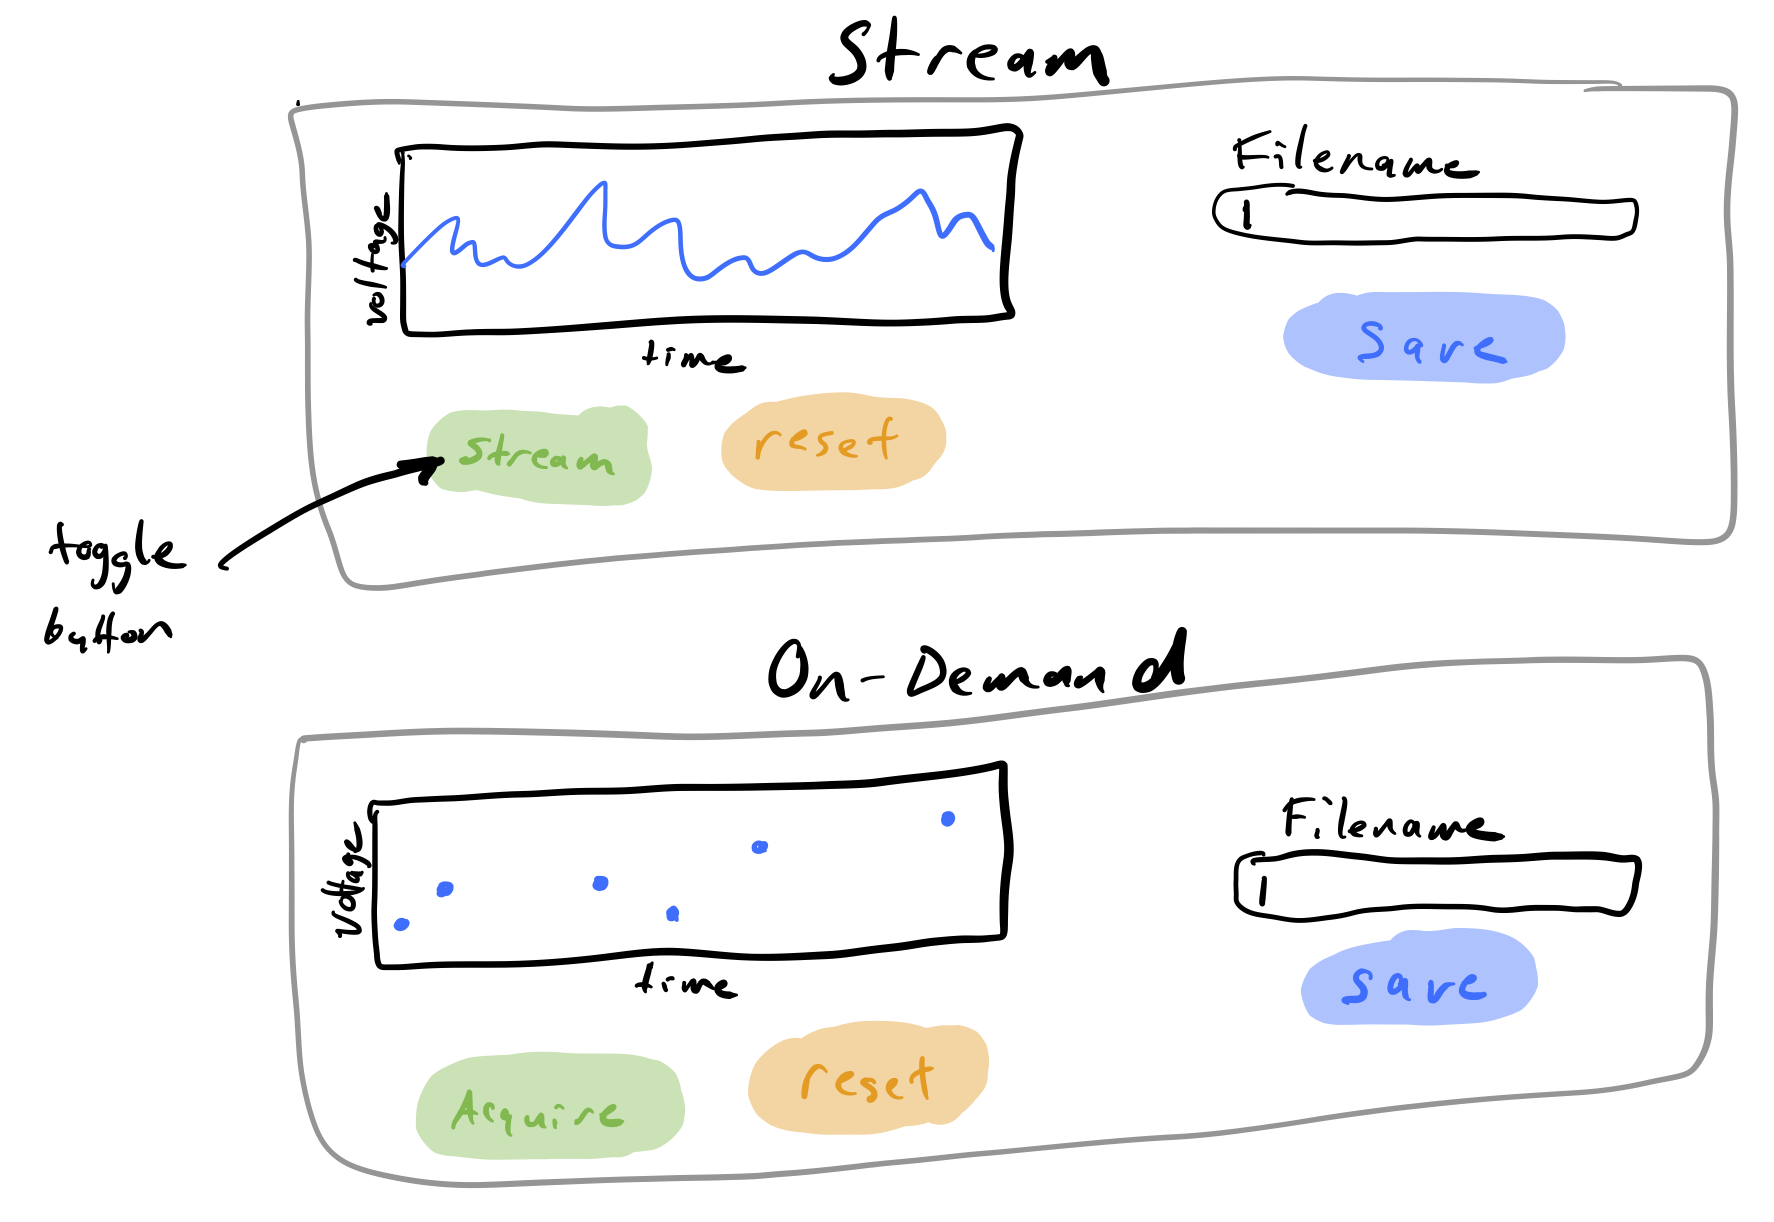
This version alleviates the problems mentioned above. The “stream” button on the stream box of the app is a toggle button, meaning that once pressed, it stays on until pressed again. Thus, one button controls whether streaming is on or off.
I also added reset buttons to both. Clicking the reset button clears the data (and stops streaming if streaming is still active) allowing fresh data to be collected.
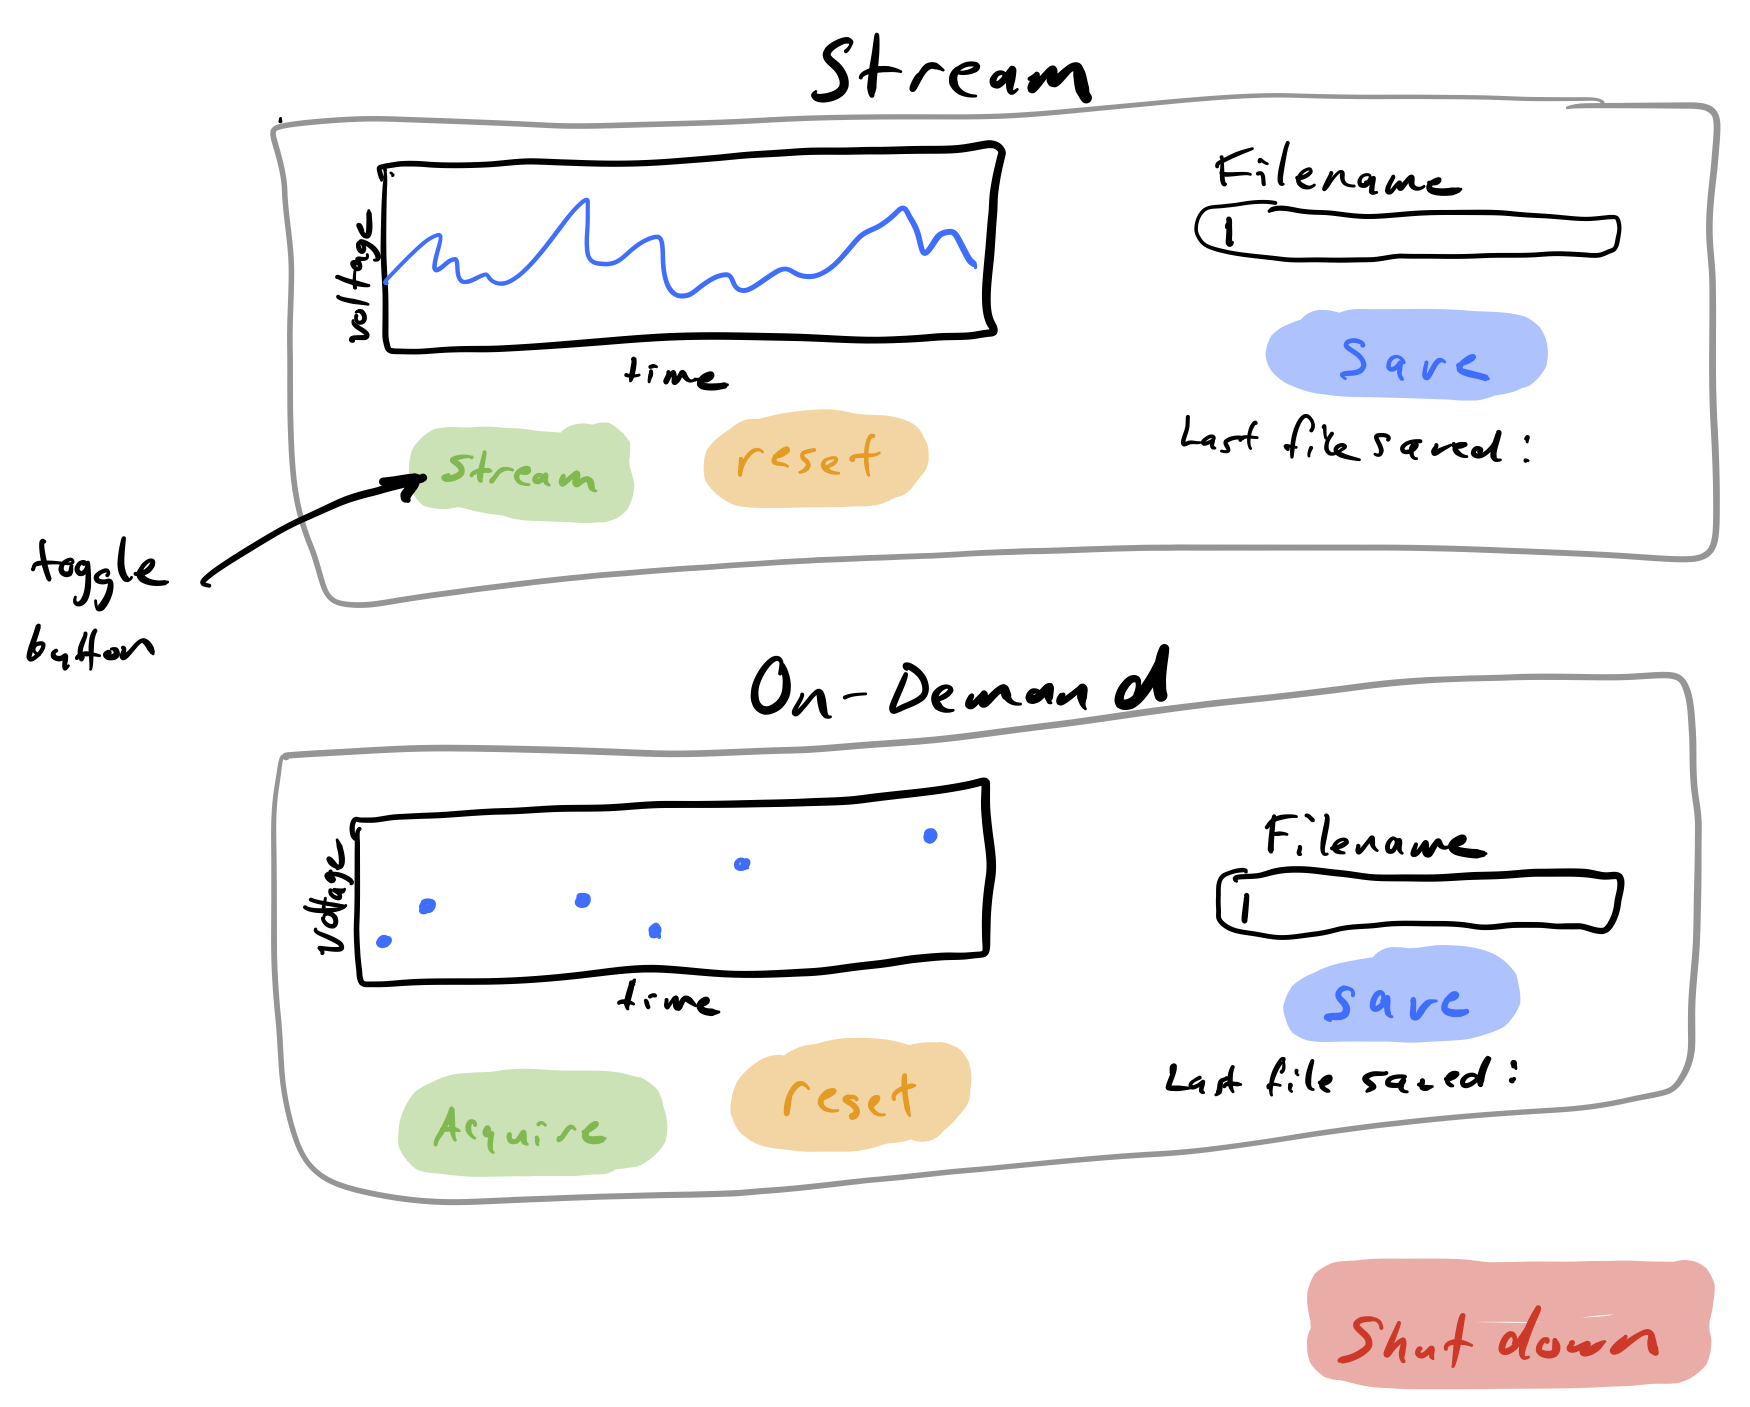
After considering this design, I decided I wanted to add two more features.
An indicator as if data had been saved to a file under the “save” button.
An option to shut down the app. In the shutdown procedure, the asynchronous data acquisition is halted and Arduino is disconnected. In the stand-alone app (that is, outside of a Jupyter notebook), the server is also shut down.
The final design I sketched is show below.
In a moment, we’ll build the components of the app: the buttons, the text inputs, the plots. First, though, we need to connect to Arduino and set up the data acquisition.
Connecting to Arduino and opening DAQ
First, we’ll open connection to Arduino in the same way we have been in the past several lessons.
[3]:
# Set up connection
HANDSHAKE = 0
VOLTAGE_REQUEST = 1
ON_REQUEST = 2;
STREAM = 3;
READ_DAQ_DELAY = 4;

port = find_arduino()
arduino = serial.Serial(port, baudrate=115200)
handshake_arduino(arduino)
Next, we need to have variables to store data coming in from streaming and on-demand. These need to be mutable objects that we can pass into data collection functions and into the function defining the Bokeh app. We will therefore use dictionaries of lists, one for streaming data and one for on-demand data. For the streaming dictionary, we should also keep two other variables, the mode of data acquisition (either 'stream' or 'on demand'), and a variable to keep track of the array length
of the data currently on the streaming plot. We need to keep that reference so we know which data points to add to the plot after each acquisition, since we acquire more than one data point at a time.
[4]:
# Set up data dictionaries
stream_data = dict(prev_array_length=0, t=[], V=[], mode='on demand')
on_demand_data = dict(t=[], V=[])
Finally, we’ll set up the data stream. We have to have another layer of logic here. If the mode entry in the steam_data dictionary changes to 'stream', we need to set Arduino to stream mode. We only want to do this when it changes to 'stream', not on every data acquisition, so we also have a local variable stream_on that keeps track of whether or not Arduino has been instructed to stream data.
[5]:
async def daq_stream_async(
    arduino, data, delay=20, n_trash_reads=5, n_reads_per_chunk=4, reader=read_all_newlines
):
    """Obtain streaming data"""
    # Specify delay
    arduino.write(bytes([READ_DAQ_DELAY]) + (str(delay) + "x").encode())

    # Current streaming state
    stream_on = False

    # Receive data
    read_buffer = [b""]
    while True:
        if data["mode"] == "stream":
            # Turn on the stream if need be
            if not stream_on:
                arduino.write(bytes([STREAM]))

                # Read and throw out first few reads
                i = 0
                while i < n_trash_reads:
                    _ = arduino.read_until()
                    i += 1

                stream_on = True

            # Read in chunk of data
            raw = reader(
                arduino, read_buffer=read_buffer[0], n_reads=n_reads_per_chunk
            )

            # Parse it, passing if it is gibberish
            try:
                t, V, read_buffer[0] = parse_read(raw)

                # Update data dictionary
                data["t"] += t
                data["V"] += V
            except:
                pass
        else:
            # Make sure stream is off
            stream_on = False

        # Sleep 80% of the time before we need to start reading chunks
        await asyncio.sleep(0.8 * n_reads_per_chunk * delay / 1000)


daq_task = asyncio.create_task(daq_stream_async(arduino, stream_data))
Building the app
The completed app needs to be contained in a single function that Bokeh can use to create the app. To practice modular programming, we will write functions to build the parts of the app one by one. These functions can then be used within the function defining the app.
We’ll start by defining the plots. When we build the plot, as before, we have to be sure to specify a ColumnDataSource.
We also need to play a little trick. With no glyphs on a plot, Bokeh does not know how to set the axes. So, we need to provide “phantom” data to the plot. We specify a phantom data source that give coordinates for a single glyph, an invisible circle.
[6]:
def plot(mode):
    """Build a plot of voltage vs time data"""
    # Set up plot area
    p = bokeh.plotting.figure(
        frame_width=500,
        frame_height=175,
        x_axis_label="time (s)",
        y_axis_label="voltage (V)",
        title="streaming data",
        y_range=[-0.2, 5.2],
        toolbar_location="above",
    )

    # No range padding on x: signal spans whole plot
    p.x_range.range_padding = 0

    # We'll sue whitesmoke backgrounds
    p.border_fill_color = "whitesmoke"

    # Defined the data source
    source = bokeh.models.ColumnDataSource(data=dict(t=[], V=[]))

    # If we are in streaming mode, use a line, dots for on-demand
    if mode == 'stream':
        p.line(source=source, x="t", y="V")
    else:
        p.circle(source=source, x="t", y="V")

    # Put a phantom circle so axis labels show before data arrive
    phantom_source = bokeh.models.ColumnDataSource(data=dict(t=[0], V=[0]))
    p.circle(source=phantom_source, x="t", y="V", visible=False)

    return p, source, phantom_source
Next, we need to build the controls and indicators. Each has a green button for acquiring data, an orange button to reset, a blue button to save, and a text window for entering the file name to save the data. There is also the text to indicate in which file the last data set was saved.
The stream control is a toggle, which stays on when clicked, as opposed to button which responds only to a single click. To instantiate a toggle, we use bokeh.models.Toggle. Similarly, to instantiate a button, we use bokeh.models.Button. Finally, we can always include an HTMV div using bokeh.models.Div, in this case containing text.
For convenience, we store the controls in a dictionary.
[7]:
def controls(mode):
    if mode == "stream":
        acquire = bokeh.models.Toggle(label="stream", button_type="success", width=100)
        save_notice = bokeh.models.Div(
            text="<p>No streaming data saved.</p>", width=165
        )
    else:
        acquire = bokeh.models.Button(label="acquire", button_type="success", width=100)
        save_notice = bokeh.models.Div(
            text="<p>No on-demand data saved.</p>", width=165
        )

    save = bokeh.models.Button(label="save", button_type="primary", width=100)
    reset = bokeh.models.Button(label="reset", button_type="warning", width=100)
    file_input = bokeh.models.TextInput(
        title="file name", value=f"{mode}.csv", width=165
    )

    return dict(
        acquire=acquire,
        reset=reset,
        save=save,
        file_input=file_input,
        save_notice=save_notice,
    )
Next, we need to lay out the plot and controls. The three main Bokeh features we will use are:
bokeh.layouts.row(): Place elements in a row.bokeh.layouts.column(): Place elements in a column.bokeh.models.Spacer: Inset space (in units of pixels) between elements.
[8]:
def layout(p, ctrls):
    buttons = bokeh.layouts.row(
        bokeh.models.Spacer(width=30),
        ctrls["acquire"],
        bokeh.models.Spacer(width=295),
        ctrls["reset"],
    )
    left = bokeh.layouts.column(p, buttons, spacing=15)
    right = bokeh.layouts.column(
        bokeh.models.Spacer(height=50),
        ctrls["file_input"],
        ctrls["save"],
        ctrls["save_notice"],
    )
    return bokeh.layouts.row(
        left, right, spacing=30, margin=(30, 30, 30, 30), background="whitesmoke",
    )
To see how this layout will looks, let’s make a plot and some controls and lay them out.
[9]:
p, source, phantom_source = plot('stream')
ctrls = controls('stream')
bokeh.io.show(layout(p, ctrls))
Looks good!
Clicking any of the buttons above will not do anything. This is because they are not connected to any callbacks, or functions that are executed when the button or toggle is clicked. We need to write the callback functions for each.
We’ll start with the callback for pressing the “acquire” button to get a single on-demand data point. When we ask for data while steaming is happening, we can just pick off the last streamed data point. Otherwise, we ask for a single voltage. In either case, we append the new data point to our on-demand data dictionary. We also updated the data source to include the new data point. To do this, we use the stream() method of a Bokeh ColumnDataSource. Using this function allows for rapid
update of the plot. Only the new data are added; the plot is not re-rendered.
Finally, we need to update the phantom data point to be the new data point to keep the ranges of the x-axis reasonable.
[10]:
def acquire_callback(arduino, stream_data, source, phantom_source, rollover):
    # Pull t and V values from stream or request from Arduino
    if stream_data["mode"] == "stream":
        t = stream_data["t"][-1]
        V = stream_data["V"][-1]
    else:
        t, V = request_single_voltage(arduino)

    # Add to on-demand data dictionary
    on_demand_data["t"].append(t)
    on_demand_data["V"].append(V)

    # Send new data to plot
    new_data = dict(t=[t / 1000], V=[V])
    source.stream(new_data, rollover=rollover)

    # Update the phantom source to keep the x_range on plot ok
    phantom_source.data = new_data
Next, we’ll write the callback for clicking the “stream” toggle. If we turn the stream on, that is if the new value of the toggle is True, we need to switch to streaming mode. (We do not need to tell Arduino to turn streaming on here; we already did that in our asynchronous DAQ function.) If we turn the toggle off, though (new is False), then we switch the mode to on-demand and tell Arduino to wait for requests to send data. Finally, just in case Arduino sent any incomplete messages
while we were trying to tell it what to do, we should clear the input buffer on the Python side.
[11]:
def stream_callback(arduino, stream_data, new):
    if new:
        stream_data["mode"] = "stream"
    else:
        stream_data["mode"] = "on-demand"
        arduino.write(bytes([ON_REQUEST]))

    arduino.reset_input_buffer()
Next, we’ll code up the callback of the reset buttons. If we’re in streaming mode, we turn off the stream. Then, we clear out all of the arrays and sources holding data.
[12]:
def reset_callback(mode, data, source, phantom_source, controls):
    # Turn off the stream
    if mode == "stream":
        controls["acquire"].active = False

    # Black out the data dictionaries
    data["t"] = []
    data["V"] = []

    # Reset the sources
    source.data = dict(t=[], V=[])
    phantom_source.data = dict(t=[0], V=[0])
Next is the save callback. In this case, we want to take the data in the data dictionary, put them in a Pandas data frame, and then write the results to the CSV file specified in the input window. We also need to update the notice text below the “save” button to indicate what we did.
[13]:
def save_callback(mode, data, controls):
    # Convert data to data frame and save
    df = pd.DataFrame(data={"time (ms)": data["t"], "voltage (V)": data["V"]})
    df.to_csv(controls["file_input"].value, index=False)

    # Update notice text
    notice_text = "<p>" + ("Streaming" if mode == "stream" else "On-demand")
    notice_text += f" data was last saved to {controls['file_input'].value}.</p>"
    controls["save_notice"].text = notice_text
We’re almost there. For the shutdown callback, we need to disable all of the controls. We do this by setting their disabled attribute to True. We also want to turn off the data stream, cancel the asynchronous data acquisition task, and close the connection to Arduino. Upon shutdown, the app is dead.
[14]:
def disable_controls(controls):
    """Disable all controls."""
    for key in controls:
        controls[key].disabled = True


def shutdown_callback(
    arduino, daq_task, stream_data, stream_controls, on_demand_controls
):
    # Disable controls
    disable_controls(stream_controls)
    disable_controls(on_demand_controls)

    # Strop streaming
    stream_data["mode"] = "on-demand"
    arduino.write(bytes([ON_REQUEST]))

    # Stop DAQ async task
    daq_task.cancel()

    # Disconnect from Arduino
    arduino.close()
And now for our final callback. This callback is called automatically by Bokeh on a regular time interval by adding it as a periodic callback. We stream the data to the source and also adjust the phantom data. Finally, it is important to keep track of the previous array length, as in the previous lesson.
[15]:
def stream_update(data, source, phantom_source, rollover):
    # Update plot by streaming in data
    new_data = {
        "t": np.array(data["t"][data["prev_array_length"] :]) / 1000,
        "V": data["V"][data["prev_array_length"] :],
    }
    source.stream(new_data, rollover)

    # Adjust new phantom data point if new data arrived
    if len(new_data["t"] > 0):
        phantom_source.data = dict(t=[new_data["t"][-1]], V=[new_data["V"][-1]])
    data["prev_array_length"] = len(data["t"])
We now have the functions we need to build the app. As we build the app, there are a few considerations to keep in mind.
The callbacks within the app must have a specific call signature. A button must have a callback with signature
callback(event=None)and a toggle must have a callback with signaturecallback(attr, old, new). So, within the app, we define callbacks with these signatures that call the functions we have defined above.If we are running the app outside of JupyterLab, the shut down button should also stop the Bokeh server. We can accomplish this by checking if the connection to Arduino is open in the periodic callback, and if it is closed, we terminate the app using
sys.exit().The callbacks we wrote need to be linked to the appropriate buttons and toggles. We do this using the
on_click()andon_change()methods of the buttons and toggles.
With these in mind, we can construct our app.
[16]:
def potentiometer_app(
    arduino, stream_data, on_demand_data, daq_task, rollover=400, stream_plot_delay=90,
):
    def _app(doc):
        # Plots
        p_stream, stream_source, stream_phantom_source = plot("stream")
        p_on_demand, on_demand_source, on_demand_phantom_source = plot("on demand")

        # Controls
        stream_controls = controls("stream")
        on_demand_controls = controls("on_demand")

        # Shut down
        shutdown_button = bokeh.models.Button(
            label="shut down", button_type="danger", width=100
        )

        # Layouts
        stream_layout = layout(p_stream, stream_controls)
        on_demand_layout = layout(p_on_demand, on_demand_controls)

        # Shut down layout
        shutdown_layout = bokeh.layouts.row(
            bokeh.models.Spacer(width=675), shutdown_button
        )

        app_layout = bokeh.layouts.column(
            stream_layout, on_demand_layout, shutdown_layout
        )

        def _acquire_callback(event=None):
            acquire_callback(
                arduino,
                stream_data,
                on_demand_source,
                on_demand_phantom_source,
                rollover,
            )

        def _stream_callback(attr, old, new):
            stream_callback(arduino, stream_data, new)

        def _stream_reset_callback(event=None):
            reset_callback(
                "stream",
                stream_data,
                stream_source,
                stream_phantom_source,
                stream_controls,
            )

        def _on_demand_reset_callback(event=None):
            reset_callback(
                "on demand",
                on_demand_data,
                on_demand_source,
                on_demand_phantom_source,
                on_demand_controls,
            )

        def _stream_save_callback(event=None):
            save_callback("stream", stream_data, stream_controls)

        def _on_demand_save_callback(event=None):
            save_callback("on demand", on_demand_data, on_demand_controls)

        def _shutdown_callback(event=None):
            shutdown_callback(
                arduino, daq_task, stream_data, stream_controls, on_demand_controls
            )

        @bokeh.driving.linear()
        def _stream_update(step):
            stream_update(stream_data, stream_source, stream_phantom_source, rollover)

            # Shut down server if Arduino disconnects (commented out in Jupyter notebook)
            if not arduino.is_open:
                sys.exit()

        # Link callbacks
        stream_controls["acquire"].on_change("active", _stream_callback)
        stream_controls["reset"].on_click(_stream_reset_callback)
        stream_controls["save"].on_click(_stream_save_callback)
        on_demand_controls["acquire"].on_click(_acquire_callback)
        on_demand_controls["reset"].on_click(_on_demand_reset_callback)
        on_demand_controls["save"].on_click(_on_demand_save_callback)
        shutdown_button.on_click(_shutdown_callback)

        # Add the layout to the app
        doc.add_root(app_layout)

        # Add a periodic callback, monitor changes in stream data
        pc = doc.add_periodic_callback(_stream_update, stream_plot_delay)

    return _app
Great! Now, let’s run it. (Unfortunately, the beautiful app will not be displayed in the static HTML rendering of this lesson.)
[17]:
bokeh.io.show(
    potentiometer_app(arduino, stream_data, on_demand_data, daq_task),
    notebook_url=notebook_url,
)
Thinking exercise 5: Safeguards
This app does not have much error checking. What kinds of features and checks would you add to this app to ensure that a careless user does not end up messing things up?
"""
App to read in varying voltages from Arduino.

To serve the app, run

    bokeh serve --show potentiometer_app.py

on the command line.
"""

import asyncio
import re
import sys
import time

import numpy as np
import pandas as pd

import serial
import serial.tools.list_ports

import bokeh.plotting
import bokeh.io
import bokeh.layouts
import bokeh.driving


def find_arduino(port=None):
    """Get the name of the port that is connected to Arduino."""
    if port is None:
        ports = serial.tools.list_ports.comports()
        for p in ports:
            if p.manufacturer is not None and "Arduino" in p.manufacturer:
                port = p.device
    return port


def handshake_arduino(
    arduino, sleep_time=1, print_handshake_message=False, handshake_code=0
):
    """Make sure connection is established by sending
    and receiving bytes."""
    # Close and reopen
    arduino.close()
    arduino.open()

    # Chill out while everything gets set
    time.sleep(sleep_time)

    # Set a long timeout to complete handshake
    timeout = arduino.timeout
    arduino.timeout = 2

    # Read and discard everything that may be in the input buffer
    _ = arduino.read_all()

    # Send request to Arduino
    arduino.write(bytes([handshake_code]))

    # Read in what Arduino sent
    handshake_message = arduino.read_until()

    # Send and receive request again
    arduino.write(bytes([handshake_code]))
    handshake_message = arduino.read_until()

    # Print the handshake message, if desired
    if print_handshake_message:
        print("Handshake message: " + handshake_message.decode())

    # Reset the timeout
    arduino.timeout = timeout


def read_all(ser, read_buffer=b"", **args):
    """Read all available bytes from the serial port
    and append to the read buffer.

    Parameters
    ----------
    ser : serial.Serial() instance
        The device we are reading from.
    read_buffer : bytes, default b''
        Previous read buffer that is appended to.

    Returns
    -------
    output : bytes
        Bytes object that contains read_buffer + read.

    Notes
    -----
    .. `**args` appears, but is never used. This is for
       compatibility with `read_all_newlines()` as a
       drop-in replacement for this function.
    """
    # Set timeout to None to make sure we read all bytes
    previous_timeout = ser.timeout
    ser.timeout = None

    in_waiting = ser.in_waiting
    read = ser.read(size=in_waiting)

    # Reset to previous timeout
    ser.timeout = previous_timeout

    return read_buffer + read


def read_all_newlines(ser, read_buffer=b"", n_reads=4):
    """Read data in until encountering newlines.

    Parameters
    ----------
    ser : serial.Serial() instance
        The device we are reading from.
    n_reads : int
        The number of reads up to newlines
    read_buffer : bytes, default b''
        Previous read buffer that is appended to.

    Returns
    -------
    output : bytes
        Bytes object that contains read_buffer + read.

    Notes
    -----
    .. This is a drop-in replacement for read_all().
    """
    raw = read_buffer
    for _ in range(n_reads):
        raw += ser.read_until()

    return raw


def parse_read(read):
    """Parse a read with time, voltage data

    Parameters
    ----------
    read : byte string
        Byte string with comma delimited time/voltage
        measurements.

    Returns
    -------
    time_ms : list of ints
        Time points in milliseconds.
    voltage : list of floats
        Voltages in volts.
    remaining_bytes : byte string
        Remaining, unparsed bytes.
    """
    time_ms = []
    voltage = []

    # Separate independent time/voltage measurements
    pattern = re.compile(b"\d+|,")
    raw_list = [b"".join(pattern.findall(raw)).decode() for raw in read.split(b"\r\n")]

    for raw in raw_list[:-1]:
        try:
            t, V = raw.split(",")
            time_ms.append(int(t))
            voltage.append(int(V) * 5 / 1023)
        except:
            pass

    if len(raw_list) == 0:
        return time_ms, voltage, b""
    else:
        return time_ms, voltage, raw_list[-1].encode()


def parse_raw(raw):
    """Parse bytes output from Arduino."""
    raw = raw.decode()
    if raw[-1] != "\n":
        raise ValueError(
            "Input must end with newline, otherwise message is incomplete."
        )

    t, V = raw.rstrip().split(",")

    return int(t), int(V) * 5 / 1023


def request_single_voltage(arduino):
    """Ask Arduino for a single data point"""
    # Ask Arduino for data
    arduino.write(bytes([VOLTAGE_REQUEST]))

    # Read in the data
    raw = arduino.read_until()

    # Parse and return
    return parse_raw(raw)


def plot(mode):
    """Build a plot of voltage vs time data"""
    # Set up plot area
    p = bokeh.plotting.figure(
        frame_width=500,
        frame_height=175,
        x_axis_label="time (s)",
        y_axis_label="voltage (V)",
        title="streaming data" if mode == "stream" else "on-demand data",
        y_range=[-0.2, 5.2],
        toolbar_location="above",
    )

    # No range padding on x: signal spans whole plot
    p.x_range.range_padding = 0

    # We'll sue whitesmoke backgrounds
    p.border_fill_color = "whitesmoke"

    # Defined the data source
    source = bokeh.models.ColumnDataSource(data=dict(t=[], V=[]))

    # If we are in streaming mode, use a line, dots for on-demand
    if mode == "stream":
        p.line(source=source, x="t", y="V")
    else:
        p.circle(source=source, x="t", y="V")

    # Put a phantom circle so axis labels show before data arrive
    phantom_source = bokeh.models.ColumnDataSource(data=dict(t=[0], V=[0]))
    p.circle(source=phantom_source, x="t", y="V", visible=False)

    return p, source, phantom_source


def controls(mode):
    if mode == "stream":
        acquire = bokeh.models.Toggle(label="stream", button_type="success", width=100)
        save_notice = bokeh.models.Div(
            text="<p>No streaming data saved.</p>", width=165
        )
    else:
        acquire = bokeh.models.Button(label="acquire", button_type="success", width=100)
        save_notice = bokeh.models.Div(
            text="<p>No on-demand data saved.</p>", width=165
        )

    save = bokeh.models.Button(label="save", button_type="primary", width=100)
    reset = bokeh.models.Button(label="reset", button_type="warning", width=100)
    file_input = bokeh.models.TextInput(
        title="file name", value=f"{mode}.csv", width=165
    )

    return dict(
        acquire=acquire,
        reset=reset,
        save=save,
        file_input=file_input,
        save_notice=save_notice,
    )


def layout(p, ctrls):
    buttons = bokeh.layouts.row(
        bokeh.models.Spacer(width=30),
        ctrls["acquire"],
        bokeh.models.Spacer(width=295),
        ctrls["reset"],
    )
    left = bokeh.layouts.column(p, buttons, spacing=15)
    right = bokeh.layouts.column(
        bokeh.models.Spacer(height=50),
        ctrls["file_input"],
        ctrls["save"],
        ctrls["save_notice"],
    )
    return bokeh.layouts.row(
        left, right, spacing=30, margin=(30, 30, 30, 30), background="whitesmoke",
    )


def acquire_callback(arduino, stream_data, source, phantom_source, rollover):
    # Pull t and V values from stream or request from Arduino
    if stream_data["mode"] == "stream":
        t = stream_data["t"][-1]
        V = stream_data["V"][-1]
    else:
        t, V = request_single_voltage(arduino)

    # Add to on-demand data dictionary
    on_demand_data["t"].append(t)
    on_demand_data["V"].append(V)

    # Send new data to plot
    new_data = dict(t=[t / 1000], V=[V])
    source.stream(new_data, rollover=rollover)

    # Update the phantom source to keep the x_range on plot ok
    phantom_source.data = new_data


def stream_callback(arduino, stream_data, new):
    if new:
        stream_data["mode"] = "stream"
    else:
        stream_data["mode"] = "on-demand"
        arduino.write(bytes([ON_REQUEST]))

    arduino.reset_input_buffer()


def reset_callback(mode, data, source, phantom_source, controls):
    # Turn off the stream
    if mode == "stream":
        controls["acquire"].active = False

    # Black out the data dictionaries
    data["t"] = []
    data["V"] = []

    # Reset the sources
    source.data = dict(t=[], V=[])
    phantom_source.data = dict(t=[0], V=[0])


def save_callback(mode, data, controls):
    # Convert data to data frame and save
    df = pd.DataFrame(data={"time (ms)": data["t"], "voltage (V)": data["V"]})
    df.to_csv(controls["file_input"].value, index=False)

    # Update notice text
    notice_text = "<p>" + ("Streaming" if mode == "stream" else "On-demand")
    notice_text += f" data was last saved to {controls['file_input'].value}.</p>"
    controls["save_notice"].text = notice_text


def disable_controls(controls):
    """Disable all controls."""
    for key in controls:
        controls[key].disabled = True


def shutdown_callback(
    arduino, daq_task, stream_data, stream_controls, on_demand_controls
):
    # Disable controls
    disable_controls(stream_controls)
    disable_controls(on_demand_controls)

    # Strop streaming
    stream_data["mode"] = "on-demand"
    arduino.write(bytes([ON_REQUEST]))

    # Stop DAQ async task
    daq_task.cancel()

    # Disconnect from Arduino
    arduino.close()


def stream_update(data, source, phantom_source, rollover):
    # Update plot by streaming in data
    new_data = {
        "t": np.array(data["t"][data["prev_array_length"] :]) / 1000,
        "V": data["V"][data["prev_array_length"] :],
    }
    source.stream(new_data, rollover)

    # Adjust new phantom data point if new data arrived
    if len(new_data["t"] > 0):
        phantom_source.data = dict(t=[new_data["t"][-1]], V=[new_data["V"][-1]])
    data["prev_array_length"] = len(data["t"])


def potentiometer_app(
    arduino, stream_data, on_demand_data, daq_task, rollover=400, stream_plot_delay=90,
):
    def _app(doc):
        # Plots
        p_stream, stream_source, stream_phantom_source = plot("stream")
        p_on_demand, on_demand_source, on_demand_phantom_source = plot("on demand")

        # Controls
        stream_controls = controls("stream")
        on_demand_controls = controls("on_demand")

        # Shut down
        shutdown_button = bokeh.models.Button(
            label="shut down", button_type="danger", width=100
        )

        # Layouts
        stream_layout = layout(p_stream, stream_controls)
        on_demand_layout = layout(p_on_demand, on_demand_controls)

        # Shut down layout
        shutdown_layout = bokeh.layouts.row(
            bokeh.models.Spacer(width=675), shutdown_button
        )

        app_layout = bokeh.layouts.column(
            stream_layout, on_demand_layout, shutdown_layout
        )

        def _acquire_callback(event=None):
            acquire_callback(
                arduino,
                stream_data,
                on_demand_source,
                on_demand_phantom_source,
                rollover,
            )

        def _stream_callback(attr, old, new):
            stream_callback(arduino, stream_data, new)

        def _stream_reset_callback(event=None):
            reset_callback(
                "stream",
                stream_data,
                stream_source,
                stream_phantom_source,
                stream_controls,
            )

        def _on_demand_reset_callback(event=None):
            reset_callback(
                "on demand",
                on_demand_data,
                on_demand_source,
                on_demand_phantom_source,
                on_demand_controls,
            )

        def _stream_save_callback(event=None):
            save_callback("stream", stream_data, stream_controls)

        def _on_demand_save_callback(event=None):
            save_callback("on demand", on_demand_data, on_demand_controls)

        def _shutdown_callback(event=None):
            shutdown_callback(
                arduino, daq_task, stream_data, stream_controls, on_demand_controls
            )

        @bokeh.driving.linear()
        def _stream_update(step):
            stream_update(stream_data, stream_source, stream_phantom_source, rollover)

            # Shut down server if Arduino disconnects (commented out in Jupyter notebook)
            if not arduino.is_open:
                sys.exit()

        # Link callbacks
        stream_controls["acquire"].on_change("active", _stream_callback)
        stream_controls["reset"].on_click(_stream_reset_callback)
        stream_controls["save"].on_click(_stream_save_callback)
        on_demand_controls["acquire"].on_click(_acquire_callback)
        on_demand_controls["reset"].on_click(_on_demand_reset_callback)
        on_demand_controls["save"].on_click(_on_demand_save_callback)
        shutdown_button.on_click(_shutdown_callback)

        # Add the layout to the app
        doc.add_root(app_layout)

        # Add a periodic callback, monitor changes in stream data
        pc = doc.add_periodic_callback(_stream_update, stream_plot_delay)

    return _app


# Set up connection
HANDSHAKE = 0
VOLTAGE_REQUEST = 1
ON_REQUEST = 2
STREAM = 3
READ_DAQ_DELAY = 4

port = find_arduino()
arduino = serial.Serial(port, baudrate=115200)
handshake_arduino(arduino)

# Set up data dictionaries
stream_data = dict(prev_array_length=0, t=[], V=[], mode="on demand")
on_demand_data = dict(t=[], V=[])


async def daq_stream_async(
    arduino,
    data,
    delay=20,
    n_trash_reads=5,
    n_reads_per_chunk=4,
    reader=read_all_newlines,
):
    """Obtain streaming data"""
    # Specify delay
    arduino.write(bytes([READ_DAQ_DELAY]) + (str(delay) + "x").encode())

    # Current streaming state
    stream_on = False

    # Receive data
    read_buffer = [b""]
    while True:
        if data["mode"] == "stream":
            # Turn on the stream if need be
            if not stream_on:
                arduino.write(bytes([STREAM]))

                # Read and throw out first few reads
                i = 0
                while i < n_trash_reads:
                    _ = arduino.read_until()
                    i += 1

                stream_on = True

            # Read in chunk of data
            raw = reader(arduino, read_buffer=read_buffer[0], n_reads=n_reads_per_chunk)

            # Parse it, passing if it is gibberish
            try:
                t, V, read_buffer[0] = parse_read(raw)

                # Update data dictionary
                data["t"] += t
                data["V"] += V
            except:
                pass
        else:
            # Make sure stream is off
            stream_on = False

        # Sleep 80% of the time before we need to start reading chunks
        await asyncio.sleep(0.8 * n_reads_per_chunk * delay / 1000)


# Set up asynchronous DAQ task
daq_task = asyncio.create_task(daq_stream_async(arduino, stream_data))

# Build app
app = potentiometer_app(
    arduino, stream_data, on_demand_data, daq_task, rollover=400, stream_plot_delay=90
)

# Build it with curdoc
app(bokeh.plotting.curdoc())
Do-it-yourself exercise 7: Potentiometer app
Update the app to allow for user input of sampling rates. Be sure to think about what the upper and lower bounds of sampling rates should be. You might also want to think about how you want the user to input the sampling rates. Do you want a text box? A set of discrete choices? A slider?
Answer to safeguards exercise
Here are some things I came up with to check for.
The user can overwrite files. There is no check to see if the file name given in for saving the data corresponds to a file that already exists.
There is also no check to see if the user enters a valid path for the file name.
The data set could get very large is the app is left on and streaming. This could overrun the available RAM.
The app assumed all connections with Arduino are working and does not give the user an indication that that is the case. I think adding a connection status div to the app would be a good idea.
Computing environment
[18]:
%load_ext watermark
%watermark -v -p numpy,pandas,serial,bokeh,jupyterlab
CPython 3.8.5
IPython 7.18.1

numpy 1.19.1
pandas 1.1.3
serial 3.4
bokeh 2.2.1
jupyterlab 2.2.6